|
 |
 |
|
|
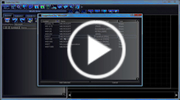
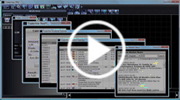
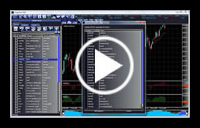
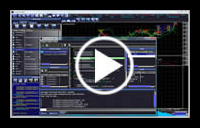
The main advantage of this program is that it gives you the complete information about stocks, indexes and currencies. You can take advantage of this feature at the very beginning, when you input a list of stocks, indexes and currencies that need a technical analysis. There are 3 ways to input stocks in the list: You can input a stock directly using its symbol ticker You can input a search criteria, such as company name, abbreviation, currency name, etc. Run the search and then select the stocks you need. You can input pre-made stock lists from your computer or network. This feature of the TraderStar allows to :
- receive the complete historical data of the selected stocks and currencies immediately; - quickly find out the contents of indexes, for example Dow Jones, Nasdaq etc; - receive information about a particular stock from different websites without leaving the program; - receive quotes updates using the RunningBoard.
|
|
 |
|
|
|
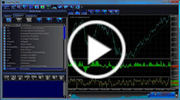
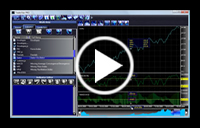
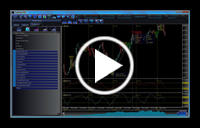
This means that TraderStar allows to quickly sort the selected stocks, indexes and currencies according to different criteria in order to give you the best options. As you probably know, there are currently over a thousand stocks and funds traded at the world's stock exchanges. Learning about all of them is a daunting task, but selecting the right ones is a task for experienced professionals. The TraderStar program will help you become a professional. Its first version contains nine different filters that process the stocks' data according to these criteria: Fill, Trend, Volume, RSI, TimeMachine, Price, UpToDate, VolumeBreakOut, MoneyFlow. The number of the filters will grow, and so will your chances of success.
|
|
 |
|
|
|
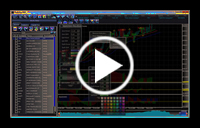
Precision plays a crucial part in technical analysis. You can point to any part of a spreadsheet and find out the exact value of a stock, fund, index, currency. Using your mouse, you can also calculate the price difference on particular dates, gains and quotes. Simple and precise calculations ease a trader's workload, increase the speed and precision of his work, living up to its promise: "The Trader will think, and the TraderStar will calculate"
|
|
 |
|
|
|
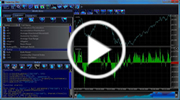
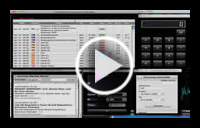
"To trade stocks means to know everything about them". TraderStar offers over 40 indicators that serve as powerful tools in the area of technical analysis. They are easy to use. Some of them are brand new and not widely known yet. Each indicator can be used by itself or combined with other indicators or with a spreadsheet. You can make your own set of indicators (templates), save it and use it later, or use the pre-made indicators recommended by the financial gurus: Trawler Week, Trawler Day, Work Template, Williams, Elder Rays, BollingerBands
)
|
|
 |
|
|
|
Over forty pre-made indicators are great but every user is unique, this is why the TraderStar offers programmers to create their own indicators in Java-Script, to perfect it in the built-in debugger and test it with historical data. If you do not have programming skills, you can order an indicator at the Neonway service center (www.neonway.com/service).
|
|
 |
|
|
|
TraderStar offers over twenty pre-made candle models that enable a more thorough analysis of the stocks' historical date, and help minimize the subjective factors. You don't have to memorize countless combinations and practice recognizing them. The TraderStar will do it for you. The combination of candle models improves your chances for success. Here are the names of premade candle templats: Doji, Harami, AbandonedBaby, BeltHold, DarkCloudCover, Dragon, Engulfing, EngulfingCross, EveningDojiStar, EveningStar, Gravestone, Hammer, HangingMan, HaramiCross, MorningDojiStar, MorningStar, PearsingLine, ThreeBlackCrows, ThreeIdenticalCrows, ThreeWhiteSoldiers, TriStar
|
|
 |
|
|
|
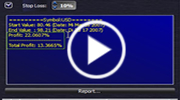
Another bonus for TraderStar users is the opportunity to learn a new skill, advance it to a professional level and develop a certain intuition, to become your own financial guru. The TraderStar has a unique simulator that lets you practice your skills in realistic scenarios without demo depot that takes a long time. Save money and become a real expert with TraderStar!
|
|
|
 |
|
|
|
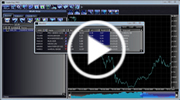
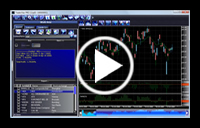
Anything you want is only one click away. This describes theTraderStar's interface. An easy-to-navigate menu and buttons, easy-to-use drawing tools, several types of calculators, economic calendar, several types of spreadsheets, the ability to have parallel settings and set time frames - all this and more is what sets the TraderStar apart from similar programs. Convenience, professionalism and elegance is the TraderStar's trademark style.
|
|
|
 |
|
|
|
Not everybody has a large screen but even the largest screens can not show you all the stock exchange Quotes at once. This is where TraderStar comes in, with its unique virtual screens where you can set the screen resolutions at 5300 x 3200 and higher. This is a unique technology, and the size of spreadsheets does not matter anymore. You will be able to see the whole picture at once on any computer monitor.
|
|
 |
|
|
|
|
One of the main advantages is that even the free version gives you an enormous range of options.
You can find the complete list of contents of the full version and the free version here.
|
|
 |
|

|
|
The TraderStar is constantly being updated. The updates also take into account the feedback from users and likely-minded programmers. The option FeedBack allows the dialogue between users and developers and gives TraderStar yet another advantage, extendability. New ideas, new indicator formulas, your wishes and critical comments lay the foundation for the TraderStar to become a true people's program.
|
|
Stay with us!
|